The research was first launched by Nominet in 2021 to provide a free annual data source for researchers, policy makers, civil society organisations and anyone else interested in the digital lives of young people living in the UK today.
The Index score provides an entry point into the dataset. It is calculated by aggregating responses to a core set of questions about digital access, connectivity, skills, safety, and wellbeing and is expressed as a score out of 100, which is a relative measure of performance that helps us to identify priorities for improvement and to track trends in the longer term.
The Index is calculated at respondent-level, which means it can be ‘sliced and diced’ to compare the scores of subgroups. Where it becomes most helpful is to compare who over or under indexes on certain areas. There is increasing attention on regional and local strategies to counter inequalities, with many requests for geographic comparisons. In this set of charts, we provide a summary view of the Digital Youth Index for each of the 12 UK nations and regions. At this level we can already see some interesting differences that may warrant further exploration.
Regional Index breakdown
Our first observation is that, looking across the five pillars, digital access has the lowest score (62 vs. 71 at total level) and should therefore be considered a priority for improvement. This makes sense given that being able to access a digital device is the first step or barrier to getting online. We know from the research that many young people do not have access to an adequate digital device when they need it. Some share or borrow devices, and many have devices that limit their ability to do the things they need to do online, e.g. relying on a mobile phone to do their homework.
Our next observation is that the ability to get online and benefit from digital technology is likely to vary depending on where they live in the UK. A young person living in Scotland, where the overall Index score is 72, is more likely to have good digital skills and connectivity compared to a young person living in the North East of England, where the Index score is less than 69. This is a generalisation, of course; at an individual level this will differ, but it is interesting because we know many factors contribute to these differences, such as infrastructure, policy, income, education, employment, and demographics.
We know for instance that during the pandemic, the Scottish Government and third sector committed a huge amount of effort and resources to the Connecting Scotland initiative. We know too that significant investment and and attention is happening in Combined Authorities on digital inclusion – such as those seen across Greater Manchester and in the Greater London Authority – how much impact are these having on regional impacts? Broad social, political, and economic issues are inherently linked to digital inclusion and so the Digital Youth Index acts like a mirror for these themes.
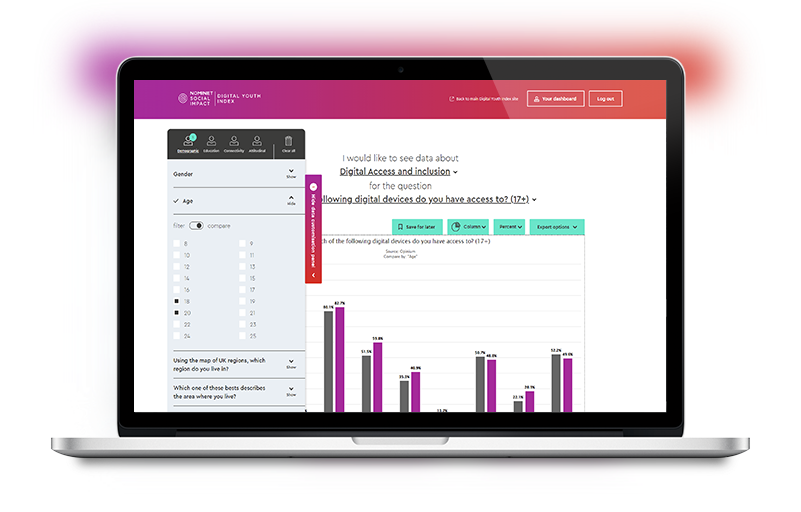
In 2022, Nominet doubled the respondent sample size of the Digital Youth Index to 4,000 so that the data can be explored in finer detail without losing confidence in the findings. We welcome you to explore the data yourself by visiting www.digitalyouthindex.uk.

Tom Baynton, Market Analyst, Nominet
Tom is a Market Analyst at Nominet, having joined the organisation in 2014 from the research agency Kantar TNS. He supports the UK registry and Social Impact teams by conducting research and analysing market and registry data. He has worked on the Digital Youth Index since its inception in 2021, with a specific focus on co-development of the DYI data tool.
Share this article